The online marketplace industry is constantly changing and evolving. Business models, market opportunities, payment systems, and many other parts of this ecosystem are in continuous flux. So, many companies use certain metrics to define and gauge whether their online marketplaces are reaching good performance and success.
However, things are not sometimes as clear as they might seem. Marketplace metrics are numerous, which of them are worth using, and for what? Is there a risk that marketplace metrics can become a thing in themselves without affecting productivity? Of course, as marketplaces vary widely in their product category and customer base, so do their benchmarks.
This article will introduce you to critical metrics that matter in your marketplace platform's success. Given that, business owners or stakeholders can select the right metrics, set goals, and make informed decisions for accelerating their platform growth.
Top metrics to measure your online marketplace platform’s success
Today, the most challenging issue with metrics is not how to measure them – Google Analytics alone is a helpful tool for calculating and displaying your performance. You need to focus on a few key metrics, spending less time tracking and more time acting upon the found data.
Depending on what your goal is – attracting a new customer segment, improving popularity with users, or getting ideas for new features – you can choose a set of proper metrics.
There are four key types of online marketplace metrics: usage, transaction, business, and user satisfaction.
Metrics to measure marketplace transactions
| Transaction metrics |
|
We are now going to take a look at some marketplace-specific metrics.
When you start looking at transaction-related metrics, it is tempting to focus on the number of transactions that might impact your value proposition. Many sellers indeed tend to look for a platform that attracts higher transactions per user like eBay, Amazon, or Etsy. However, the number of transactions is a vanity metric: it does not tell you how you should enhance your platform's performance. Instead, we recommend focusing on the following indicators to support long-term growth: liquidity, average order value, buyer-to-seller ratio, and repeat purchase ratio.
Liquidity is the lifeblood of the marketplaces. It's critical to consider how buyers and sellers transact with each other. And this can be calculated both on the buyer's and the seller's sides.
Seller liquidity defines the percentage of listings that result in transactions within a given time period. Below is how to calculate seller liquidity:

However, seller liquidity varies based on different types of marketplaces. Let's consider how this works in practice:
- Uber measures the percentage of drivers on duty that are giving a ride at any given time.
- Etsy tracks the percentage of products available that are sold in a month.
- Airbnb calculates the proportion of rooms that are booked each night.
Buyer liquidity showcases the probability of a visit that will turn into a transaction. A simple way to estimate your buyer liquidity:

One useful marketplace metric to monitor is the average order value (AOV). This indicator represents how much users spend on a marketplace daily, weekly, or monthly. For this reason, marketplace owners can get a clear picture of customers’ buying patterns. A high AOV indicates highly planned one-off purchases. A low AOV points out potentially more impulsive and recurring purchases. It can be identified with a simple formula:

Popular marketplaces like Amazon pay particular attention to AOV since this marketplace metric provides valuable information about customers’ habits, order updates, and market trends. Knowing your AOV can let you create a sustainable business model for your online marketplace.
Another crucial metric to follow and better understand the nature of your marketplace's inner dynamics is the buyer-to-seller ratio (also called the provider-to-customer ratio). It's the proportion of each seller serving a specific number of buyers. There are no fixed buyer-to-seller ratios. For new startups, this ratio is usually between 1:3 and 1:6. In contrast, for a stable retail market (as a rule of thumb), the average ratio is 2-3 buyers for every seller. In some cases, it can be as low as 1:1, but finding the optimum balance is essential. So, the initial phase should be focused on building value through proper supply channels. As you scale your business, you can go for better buyer-to-seller ratios.
The repeat buy ratio is also an interesting transaction metric. It shows how many of your transactions are repeat purchases, i.e., from users who have previously purchased from your marketplace. The higher the percentage is, the more money you can spend on acquiring a new customer. You probably gain a customer who will likely make multiple transactions. Conversely, if it is unlikely that a repeat purchase will occur, you might run into trouble when trying to grow.
Metrics to analyze and grow user engagement
| Usage metrics |
|
The usage metrics will show how your product development efforts transform into user interactions. They let you figure out how many people visit your site and how much time they spend on it. They include monthly active users, traffic, bounce rate, and time spent on site. These metrics are not specific to marketplaces, and every website monitors the same basic metrics to track its growth.
Monthly active users (MAU) and daily active users (DAU) demonstrate active users engaged with your product/service during a given time period – beyond traffic, downloads, or installs. They can be used to calculate the DAU/MAU ratio to get the user ratio percentage. By this metric, you can find out how desirable and popular your marketplaces are, assess the customer experience as well as the effectiveness of marketing campaigns, and then strategize consumer retention.
Traffic (paid/organic) mainly applies to marketplace websites. It shows the general number of people who found and visited the website via organic search, paid search, social media ads, or sponsored content. Hence, you can understand which type of marketing is more effective for your platform. For instance, regarding paid traffic, it will enable you to find out whether you should continue the promotion and how correct your targeting is.
The bounce rate allows for measuring the percentage of users who visited only one page of a website/app and left. The lower the bounce rate on your platform, the more conversions you get. Analyzing and tracking bounce rates can help you identify your online marketplace platform’s issues and strategize a retargeting campaign to drive traffic back.
Another metric to consider is the time spent on the platform. If your users do not bounce, you can start tracking how much time they spend on it. This metric will help you identify the blockers or obstacles in navigation and even the most popular pages visitors are interested in. For example, if too much time is spent on the checkout page, there will be problems with completing a transaction.
Today, providers are able to utilize websites to compare these metrics and select a marketplace where they can offer their products/services. If your providers/sellers are savvy, they will ask about them.
Metrics to forecast the business success of a marketplace platform
| Business metrics |
|
The goal of business metrics is to answer queries about revenue, profitability, and customer acquisition. The four most important business figures are gross merchandise volume, customer acquisition cost, customer lifetime value, and take rate.
Gross Merchandise Volume (GMV) is the Holy Grail of marketplace metrics. It measures the total revenue of goods/services sold on the marketplace platform during a specific time period. It's better to keep track of GMV early on and analyze it systematically. You can calculate GMV post-cancellations and returns to get the most accurate and reliable performed transactions possible. If you want to use only one figure to assess the total growth of your marketplace, you can select GMV instead of the number of users/ products.
Here's how to calculate GMV:

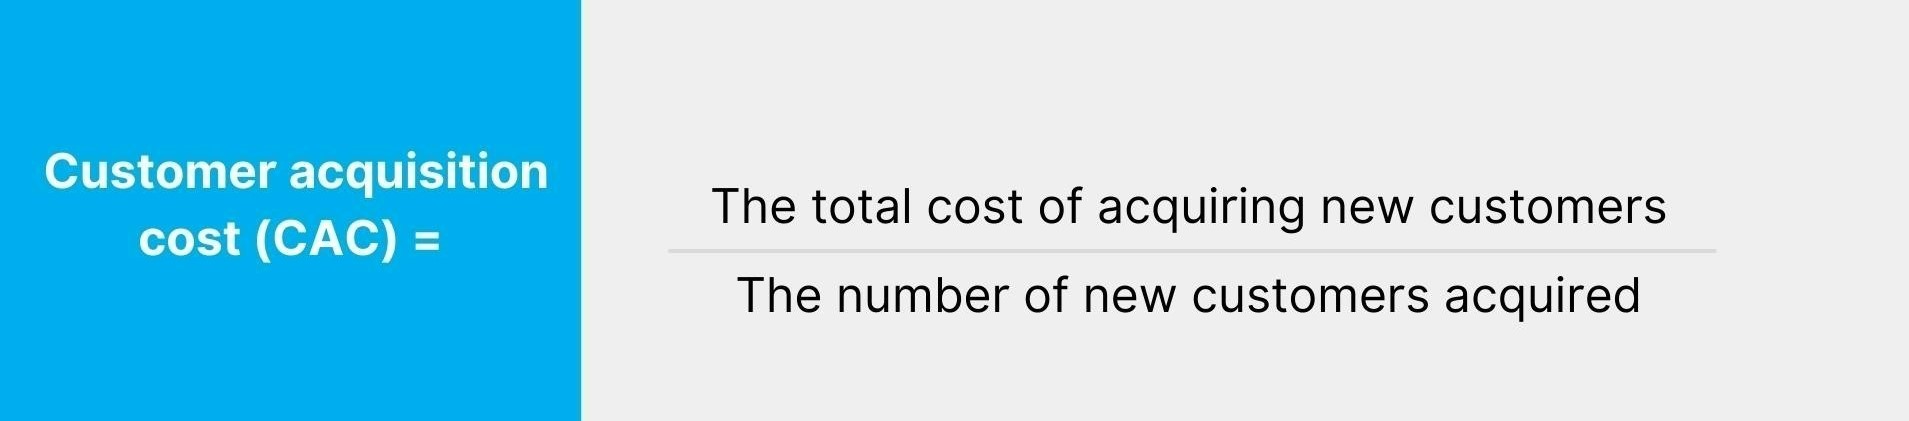
Customer acquisition cost (CAC) shows your business's costs to acquire a new customer, including marketing and sales expenses. Ideally, CAC is close to zero, indicating that the audience grows organically. If the CAC rises extremely, business owners risk running a business that's not profitable enough. To avoid overspending, it's critical to measure all business spending and adjust marketing efforts in time.
You can calculate your CAC using this formula:
Customer lifetime value (a.k.a. CLV or LTV) represents the total revenue you expect from each customer. Calculating an accurate CLV can be challenging since it depends on how long you are able to retain a customer, how many repeat transactions you expect them to make, and the size of your average transaction. But the best thing about tracking CLV is that it can help you achieve the right buyer to seller ratio. Another essential aspect of CLV to keep in mind is that it should be more than CAC for better growth sustainability. If CAC is more than revenue per user, you will face a massive cash crunch as you scale. Tracking this metric also enables you to test and choose the proper customer acquisition channels, purchasing cycles, and retention strategies.
A marketplace company's revenue is the total amount of commissions, fees, and any other monetization strategies applied to the transactions on the platform. You've likely heard it mentioned as the "take rate."
Like regular pricing models, the rates come in various shapes and sizes. They can come as a fixed or flexible commission, a flat fee, a percentage, and even subscription-based. The challenge for a reliable online marketplace is to establish a take rate that promotes both supply and demand while also allowing the marketplace to grow. Finding that ideal take rate is critical since a take rate that is too high can cause troubles in the long run. The value of this rate varies depending on the type of product/service being transacted and the marketplace's business model. You can measure the rate according to the following formula. On average, the rate ranges between 5–30%.

For instance, Upwork has a regressive take rate model, charging less when billing more, scaling down from 20% to 5%. This price is only applied to freelancers; therefore, it is one-sided. Meanwhile, Airbnb charges a two-sided commission. While the percentage for host stays is set at a 3% fee, the service fee for guests fluctuates around 20%. And if the costs of booking rise, that percentage decreases.
Metrics to evaluate user satisfaction
| User satisfaction metrics |
|
Trust and safety are vital metrics for your online marketplace success. As marketplace users make their way through transactions, they can face multiple risks - and so building trust is critical to keeping customers and vendors onboard. From the outset of your project, you should identify metrics that will enable you to measure trust. Many approaches can make users feel like they're in a trustworthy space, like well-thought-out identity verification, a detailed feedback system; efficient means of communication between users; swift problem resolution; and robust anti-fraud measures.
We'll go over two useful methods for marketplace businesses to measure user satisfaction: Net Promoter Score (NPS) and Customer Satisfaction Score (CSAT).
Net Promoter Score tracks the likeliness of your customers to recommend your marketplace to their network. It is commonly used to measure the overall customer experience instead of specific customer touchpoints. After purchase, you may email the customers one question and ask them to rank your product/service from 0 to 10. The sample question may be, "How likely is it that you would recommend [your brand] to your friend or colleague?"
Then, you can divide their answers into three categories:
- 9-10: Promoters who are loyal enthusiasts keep buying from you and readily recommend your brand to others.
- 7-8: Passives are neutral customers and satisfied with your product/service but aren't enthusiastic. They are often vulnerable to offerings from competitors.
- 0-6: Detractors are unhappy customers who will share their disappointment and sometimes have a negative impact on your brand.
The NPS formula is:

If an NPS greater than zero is regarded as good, one greater than 50 is considered excellent. Yet, you shouldn't pay too much attention to your initial rating because it isn’t meaningful. Instead, you should track the rating over time to discover whether customer satisfaction is going up or down. Given that, you can get to the root of detractors' problems, deliver your customers more value, and improve their customers' overall experience.
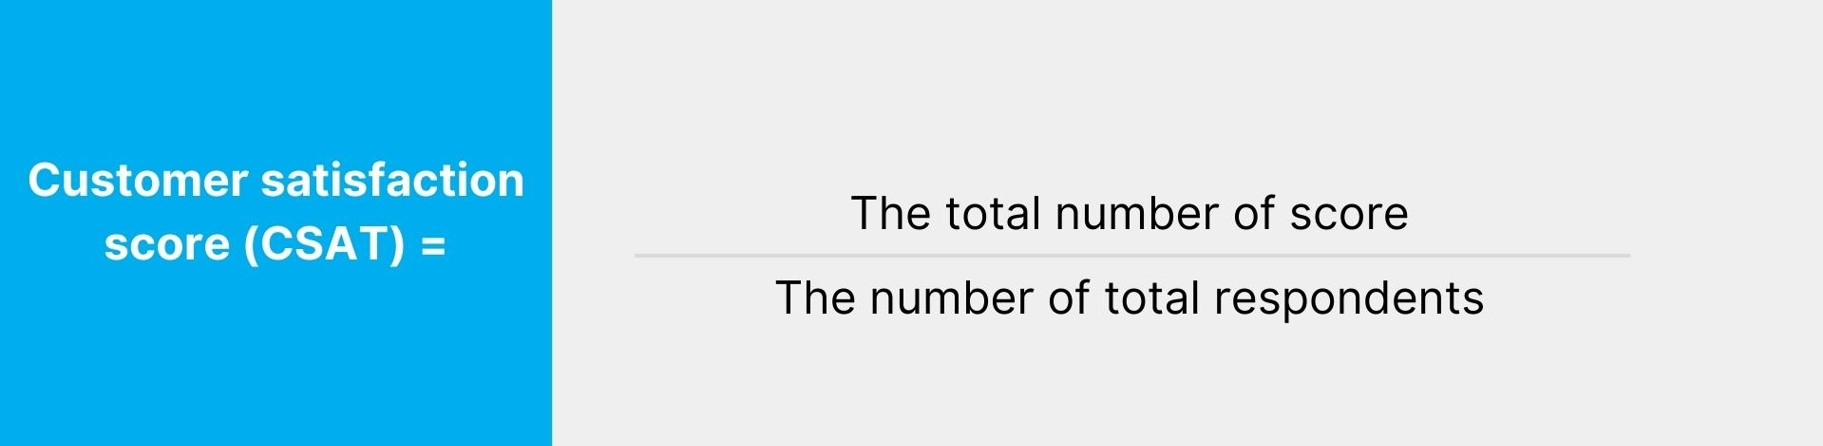
The Customer Satisfaction Score (CSAT) assesses a user's overall satisfaction or dissatisfaction with a specific product/service. Users are usually asked to rate a product/service on a scale of 1-3, 1-5, or 1-10. You can use the following formula to calculate your CSAT:
Also, you are able to utilize this metric as an industry benchmark – the American Customer Satisfaction Index logs data from the biggest companies and compares statistics with previous results. It will help you gain deeper insights from customers' feedback along the customer journey and motivate you to craft better experiences for them. What's more, you can use other approaches to ask customers for feedback, like Customer Effort Score (CES), Smileys, 5-star, and Thumbs survey, to name a few.
Vanity metrics vs. actionable metrics: Which one should you measure?
Choosing the KPIs and metrics among two types of metrics: vanity and actionable metrics, to analyze the growth of your marketplace platform are also challenging.
Vanity metrics make your marketplace look good on the surface but have little to do with real performance and viability. For example, when a marketplace startup company reaches its growth stage, the vanity metrics may be helpful to measure this growth. It makes sense for a company scaling up to measure the number of downloads, monthly/daily active users, page views, or time spent on your site. The values of these metrics over time indicate the growth rate. But we need to observe the actionable metrics in order to conclude if this growth is sustainable.
Actionable metrics tie specific actions to observed results. They’ll allow you to better understand how you can optimize your outputs and drive more meaningful actions. Let me show you an example. When the startup is trying to reach its product-market fit, it needs to focus on actionable metrics. They could be the conversion rate, customer acquisition costs, lifetime value, liquidity, and gross merchandise volume.
After all, it should be noted that vanity metrics are not useless. Both vanity and actionable ones can be informative, and they can be combined to produce actionable insights. As a result, it would be essential to strike a balance between all of them to validate your marketplace and its business model. Eventually, that’ll drive your business the furthest.
Read also:
- How to build an online marketplace platform
- How to build an online B2B marketplace platform
- Top essential features of a B2C marketplace platform
- How to choose the right revenue model for a sustainable marketplace platform
- How to choose the best-fit marketplace development approach to your situation
- How to choose a best-fit marketplace payment service provider
Final thoughts,
Measuring and assessing metrics is key to ensuring your marketplace is on its way to success. Online marketplace metrics make it possible to determine how your marketplace is running effectively, where improvements are needed, and how to optimize performance. Success might vary depending on the type of marketplace. Which ones to use for your business depends on which area you want to focus on to improve.
We hope this sharing can serve as an introduction to some key marketplace metrics that many marketplace businesses use to measure their marketplace success.